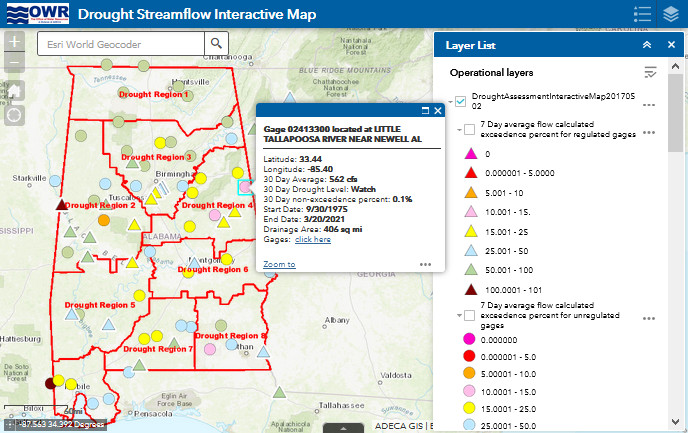
Information shown on the map provides drought and low-flow streamflow conditions at selected sites across Alabama. The information is available for four specific time periods: 7, 30, 60, and 90-day statistical summaries.
Click to visit the GIS Drought Data Map
Overview
This application provides drought and low-flow streamflow information for selected regulated and unregulated gages that impact Alabama. Graphs are usually updated on a weekly basis and posted on Monday. By clicking on a particular location, you are provided information about current streamflow conditions at that site. By clicking on the Graph area of that information, you are provided with detailed hydrological summaries that include: 7, 30, 60, and 90-day average flows with calculated exceedance percentiles as of the report date; Plots of 7-day minimum flows and the associated frequency curve; and Additional graphical and tabular summaries of the data.
Documents
Contact
Phone: (334) 242-5499 | Toll free: (877) ALA WATER